Convertion of data into clear visual metrics
Integration of multi-source data
React
PBX
GISWeb
Clear visibility into data
Improvement the client's ability to intervene
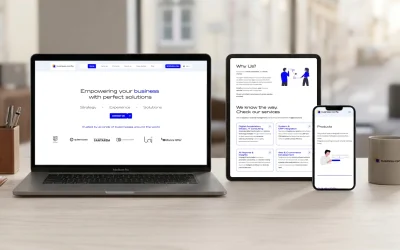
Real-Time Insights for Better Business Evolution
In this day and age, real-time data and metrics are valuable resources for understanding a company’s evolution. Specifically, an interactive dashboard compiles Big Data to provide productivity information and short-term predictions. To achieve this, we cross-reference and interpret data from multiple sources to ensure the final output is clear and visual.
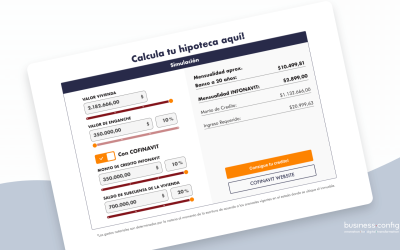
The Case of Scal: From Data to Profitability
Scal is an insurance broker with over 25 years of experience. Currently, one of its main sales channels operates by phone, where salespeople offer insurance based on customer needs. To understand their day-to-day profitability, Scal asked Business Config to create a dashboard for daily metrics.
To build this solution, we developed a dashboard that integrates two main data streams:
- Communication Data: Information from the PBX phone system.
- Insurance Data: Information pulled directly from GISWeb.
Regarding the technology, we built the frontend using Laravel and React. Furthermore, we designed a simple and clear dashboard that cross-references information from each product and commercial agent. As a result, the company can now monitor its performance with total precision.
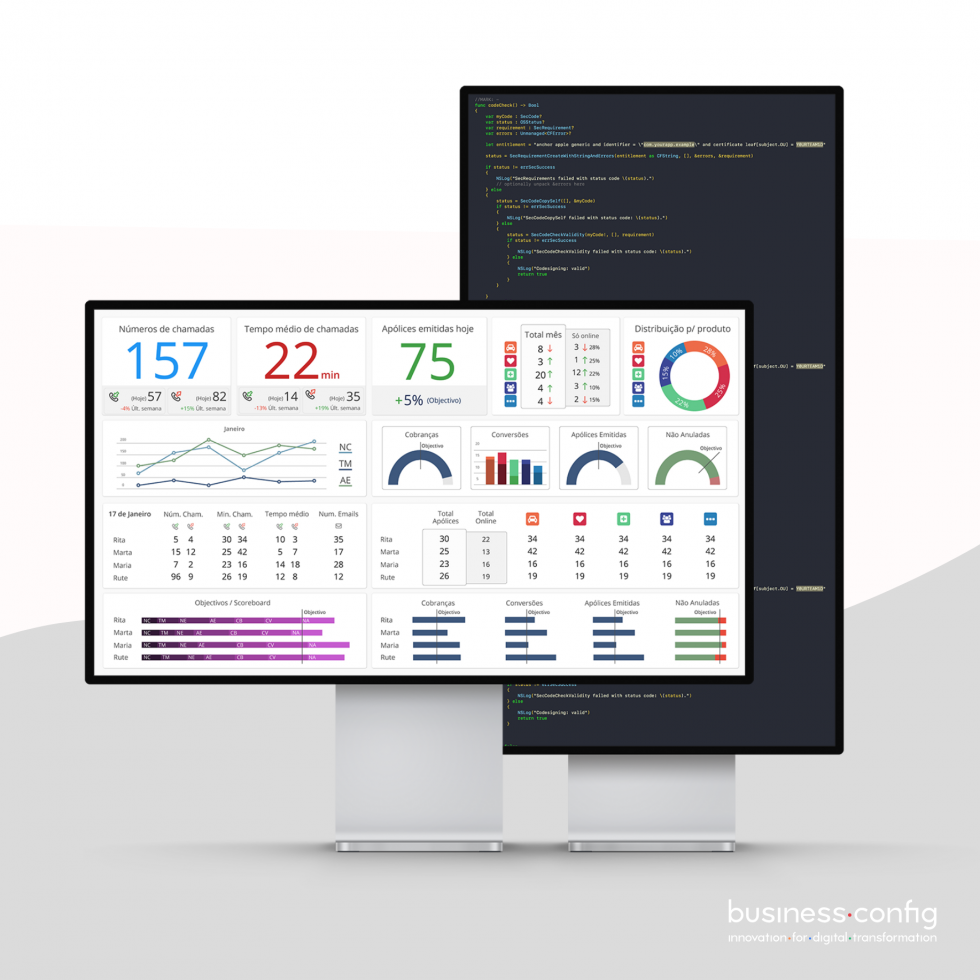
Transforming Raw Data into Strategic Insights
With this tool, it is possible to analyze the number of minutes and calls made. Furthermore, managers can track which products were sold and how many insurance policies were contracted or cancelled. In this way, we can clearly visualize data that was previously impossible to understand in complex Excel tables.
Essentially, digital transformation involves many types of solutions. You don’t need to reinvent the wheel when you can simply refine what already exists. Instead, our team focused on presenting the client’s existing data in a clearer format. Consequently, Scal gained a better perception of their business evolution. This clarity allows them to intervene quickly and improve their numbers.
If you manage Big Data that is important for your business, we can help you. If you need to transform spreadsheet information into visual and easy-to-interpret metrics, talk to us! We are ready for every challenge!